tl;dr
As long as you don't need sub-second resolution, Graphite (the scalable realtime graphing database) is excellent to store and plot readings coming from different sensors. In this post, I briefly present Graphite and provide example Labview VIs showing how to push metrics into Graphite via TCP and RabbitMQ.
Download Labview codeMotivation
Most of my PhD experiments revolve around preparing samples and caracterizing them using an home built low-temperature atomic force microscope. As you can imagine, there are a lot of parameters I want to keep track of like temperature and pressure for example. To make sure everything is behaving properly, I watch the readings coming from different sensors and occasionally write down their values in my lab book to compare them with the previous ones.
This feels like the Middle Ages. This is why I decided to automate the acquisition and the plotting of this data to get consistent logging, around the clock monitoring, fancy dashboards accessible over the Internet and the full history of the system's state.
Storing and graphing time-series data with Graphite
Obviously there are many tools to store time-series data. However, as long as you don't need sub-second resolution, you pretty much have the same needs as the server monitoring crowd. And with cloud applications becoming prevalent, there are a lot of ongoing efforts to develop better tools for this purpose. Graphite is a quality project that came out of those efforts and it does exactly what we want:
- Store numeric time-series data
- Render graphs of this data on demand
Installation
This is well covered elsewhere. However, if you want to quickly get things up and you are on a secure network, you can run the following on a clean Ubuntu installation (tested on 12.04):
curl -L "http://antoineroygobeil.com/blog/2013/7/2/labview-rabbitmq-graphite/static/install.sh" | sudo bashClick for more details on this installation script
This script will install Chef and Graphite by reusing the following cookbook.
- Graphite TCP port: 2003
- Graphite HTML dashboard accessible on port 80
- Graphite username: root
- Graphite password: password
- RabbitMQ username: guest
- RabbitMQ password: guest
- RabbitMQ port: 5672
Feeding data in
The good thing about Graphite is that data can be sent via different protocols (UDP, TCP or AMQP) and it is dead simple to talk to. For example, you can just run the following in your terminal to feed data in:
PORT=2003
SERVER=graphite.yourlab.org
echo "afm.temperature 77 `date +%s`" | nc ${SERVER} ${PORT};
Note that since data is stored in a round-robin database (circular buffer), the storage footprint remains constant over time1.
Plotting data
By default, you get a pretty decent web application that makes it easy to create dashboards for large monitors or TVs. However, if all you want is to render a graph of some data, you can just use the highly customizable Render URL API:
# afm temperature plot 800x400 in PNG format ready to be embedded
http://graphite.mylab.org/render?target=afm.temperature&height=800&width=400&format=png
Further customization
If you prefer to generate the graphs yourself to achieve a particular result, it is entirely possible to do so by requesting CSV or JSON over the Render URL API. There are already great projects out there that are compatible with this endpoint.
For example, Cubism.js renders graph dynamically in web browsers for "realtime" visualization:
Minor gotcha
Note that if you want to refresh graphs every second and you're using Memcache, you will need to add this to your local_settings.py file to only cache data for 1 second2:
MEMCACHE_DURATION = 1Labview integration
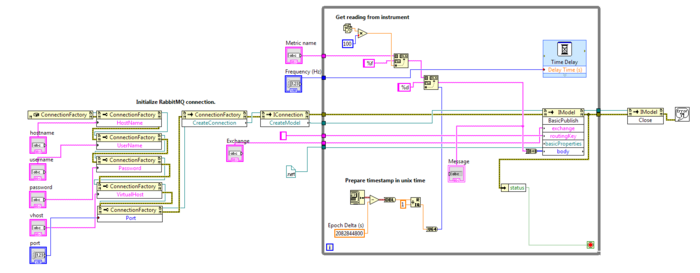
At the moment, most of my sensors and signal acquisition boards only have drivers for Labview which I don't know very well. To make things worse, I wanted to get data into Graphite via an AMQP broker (which is a bit more tricky than using UDP or TCP) since this provides more flexibility. Unfortunately, I couldn't find anything ready to use on Google.

I ended up putting together example VIs to send metrics to Graphite using TCP and RabbitMQ. I hope that Google will index this page quickly and that it will save someone else some time.
Download Labview code